
Every year around 1.3 million Australian students sit roughly 4.9 million NAPLAN tests. It happens in a nine day window in March, it covers four domains, and by the time the individual report reaches home in the middle of the year most families have stopped thinking about it.
Then, two or three years later, an enrolment officer at an independent school asks for a copy.
This guide covers what is in each test, how many questions your child will see, how the adaptive design decides their score, and where those results turn up later. Everything about test structure comes from ACARA's published assessment framework, so the numbers below are the real ones, not estimates.
The shape of the thing
NAPLAN is a full cohort assessment, which means it is not a selection test and no one applies to sit it. Every student in Years 3, 5, 7 and 9 takes part unless the school arranges an exemption or the family withdraws them.
There are four domains, and schools run them in a fixed order: writing first, then reading, then conventions of language, then numeracy. Writing is scheduled on day one across the country because every student at a year level has to sit the same prompt on the same day, and the prompt changes daily after that.
Since 2023 the tests are delivered online through a locked down browser, with one exception: Year 3 students still write by hand on paper, because ACARA does not assume nine year olds have the typing skills to be assessed fairly on a keyboard.
The 2026 window ran from 11 to 23 March. The 2027 window is confirmed for 10 to 22 March. Schools pick their own days inside that window, so ask your child's school for its timetable in Term 1 rather than assuming a national date.
What each subject actually tests
Writing
One prompt, either narrative or persuasive. Students do not get to choose the text type or the topic, and the prompts stay sealed until the morning they are used. Year 3 gets 40 minutes on paper. Years 5, 7 and 9 get 42 minutes on screen.
Marking is done against ten separate criteria, and this is where most families underestimate the test. Spelling and punctuation are each worth up to six and five score points respectively, but so is audience, the writer's ability to engage and affect a reader. Text structure, ideas, vocabulary, cohesion, paragraphing and sentence structure all carry their own bands. A clean, error free piece with no shape to it does not score well.
Reading
Students work through units. A unit is one stimulus text with five to eight questions attached. Years 3 and 5 see six or seven units. Years 7 and 9 see nine, and the texts get longer as the pathway gets harder.
The mix of text types is deliberate. In Years 3 and 5 the test leans imaginative, with informative and persuasive material filling out the rest. By Years 7 and 9 all three types carry roughly equal weight, and the cognitive demand shifts noticeably: locating information on the page drops to as little as 15 per cent of the test, while integrating, interpreting, analysing and evaluating take over. Students who are good at finding the sentence that matches the question will hit a wall in Year 7 if that is all they can do.
Conventions of language
Two sections, and the first one locks behind you. Spelling comes first: 25 items delivered partly as audio dictation, where a sentence is read aloud and the student types the missing word, and partly as proofreading, where a misspelled word has to be found and corrected. In some proofreading items the error is highlighted for you. In others it is not, and there are at least three other tricky but correctly spelled words in the sentence to look past.
Grammar and punctuation follows with 27 items, weighted about two thirds grammar and one third punctuation. Once a student moves into this section they cannot go back to spelling.
This is the one test where the structure does not change by year level. Year 3 and Year 9 both face 52 items in 45 minutes. Only the difficulty moves.
Numeracy
Content is drawn from Number, Algebra, Measurement, Space, Statistics and Probability. Number dominates at 35 to 45 per cent across most year levels. Probability appears from Year 5 onwards. Algebra roughly doubles in weight by Year 9.
Years 7 and 9 sit two sections in one sitting: a non calculator section first, built around mental calculation, then a calculator allowed section. Like spelling, the non calculator part locks once you leave it. Years 3 and 5 have no calculator at all, so calculation fluency is being tested directly.
The numbers, by year level
| Domain | Year 3 | Year 5 | Year 7 | Year 9 |
|---|---|---|---|---|
| Reading | 39 items · 45 min | 39 items · 50 min | 48 items · 65 min | 48 items · 65 min |
| Conventions of language | 52 items · 45 min | 52 items · 45 min | 52 items · 45 min | 52 items · 45 min |
| Numeracy | 36 items · 45 min | 42 items · 50 min | 48 items · 65 min | 48 items · 65 min |
| Writing | 1 prompt · 40 min, paper | 1 prompt · 42 min | 1 prompt · 42 min | 1 prompt · 42 min |
Item counts and durations per ACARA's NAPLAN assessment framework (updated December 2025). Conventions of language splits into 25 spelling items and 27 grammar and punctuation items at every year level. Years 7 and 9 numeracy combines a non calculator and a calculator allowed section within the 65 minutes.
Totalled up, a Year 3 student answers around 127 questions plus a written piece. A Year 9 student answers 148 plus a written piece. That is a meaningful amount of assessment for a test parents are told not to think about.
The part almost nobody explains: your child does not sit the same test as the child next to them
Reading, numeracy, and the grammar and punctuation section all use a multistage tailored design. The test is built from testlets, small blocks of questions that are handed out based on how the student is going.
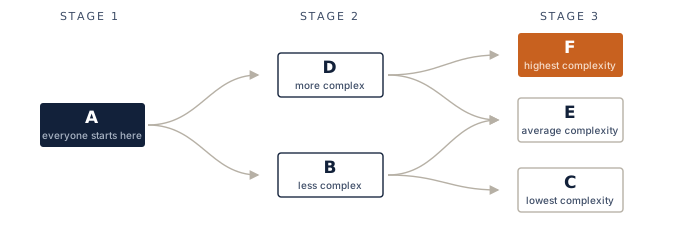
Every student completes three testlets. The first one decides whether stage two is harder or easier, and the first two together decide stage three. Students who score very low in stage one are routed straight to the lowest complexity material.
Here is the consequence, and it is the single most misunderstood feature of NAPLAN: the score depends on both how many questions were answered correctly and how hard the assigned questions were. Two students can get the same number right and land in different proficiency levels, because one of them was working through a harder pathway.
Question formats worth practising
Multiple choice is still the backbone, and where possible there are four options. But the online platform uses a much wider set of formats, and a student who has only ever done paper practice meets several of them for the first time under timed conditions:
- Drag and drop matching, including dragging text or images into positions on a diagram
- Draw lines to connect items across two columns
- Checkbox grids, for example classifying outcomes as certain, likely, unlikely or impossible
- Gap match, filling several blanks in a passage from a source list
- Hot spot and hot text, selecting regions of an image or specific words in a passage
- Drop down menus inside a sentence, often several within one item
- Text entry, typing a numeral, word or short phrase with no options to choose from
- Select all that apply, where partial answers earn nothing
Digital rulers, protractors and calculators are switched on by ACARA at testlet level, so they appear for some blocks and not others. Audio is available on every numeracy item, all spelling dictation items and the writing prompt.
How results are reported
Since 2023 there are four proficiency levels rather than the old ten bands:
- Exceeding, above expectations at the time of testing
- Strong, meeting a challenging but reasonable expectation
- Developing, working towards expectations
- Needs additional support, likely to require intervention to progress
Results for all year levels sit on a single scale per domain, which is why a Year 5 result can be compared meaningfully with the same child's Year 3 result. Growth between one test and the next, two years later, is the measure schools care about most, and it is what My School publishes at school level.
Schools receive their reporting first. Individual student reports reach families through the school later in the year, with timing set by each state's test administration authority.
Where the report shows up again: enrolment and scholarship applications
This is the reason NAPLAN deserves more attention than the official messaging suggests. Independent schools routinely ask for NAPLAN reports as supporting documentation, both for standard enrolment and for scholarship rounds. A sample of what schools currently publish:
The pattern holds outside Victoria too. Brisbane Grammar School, for instance, asks waiting list families for Year 3 NAPLAN results when it reviews Year 7 applicants.
Notice how the timing lines up. NAPLAN runs in March. Scholarship registrations for the following year typically close in January or February, with supporting documents due around March. So:
- The Year 3 report is often the only NAPLAN result on file when a school reviews a Year 7 waiting list years in advance.
- The Year 5 report is the one that sits in the folder for Year 7 scholarship and entry rounds.
- The Year 7 report supports Year 9 applications, which is exactly when most independent schools run their largest scholarship intake.
- The Year 9 report supports Year 10 and Year 11 entry.
What a real report looks like
The report itself is sparse. For each domain you get one dot on a scale, a marker for the national average, and a shaded band showing where the middle 60 per cent of students in that year level sit. No mark out of anything, no percentage, no ranking.

Four zones replace the old Band 1 to Band 10 scale. There is no mark out of anything.
Below are two real profiles, redrawn with names, schools and identifiers removed. They are worth sitting with, because they show the two most common ways parents misread the page.
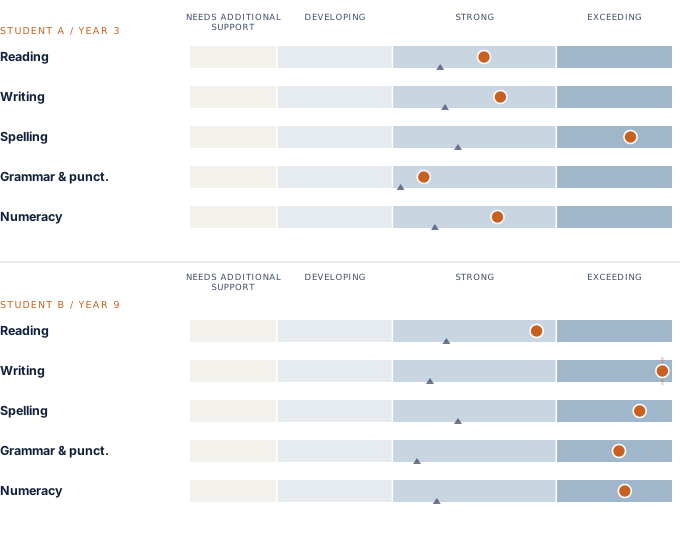
Redrawn from two individual student reports. Zone widths are shown equal for legibility; on the real report the cut points sit at different places for each domain. The triangle marks the national average for that year level.
Student A looks uniformly fine. Four Strongs and one Exceeding. The obvious read is that nothing needs attention. Look again at the two halves of the same 45 minute paper: spelling sits well up in Exceeding, and grammar and punctuation sits low in Strong, barely clear of the national average. That is a wide spread inside one test, and the report gives you no way to tell whether the grammar result is about clause structure, pronoun reference, apostrophes or commas in lists.
Student B looks like nothing needs attention either. Exceeding in numeracy, writing, spelling, and grammar and punctuation, with writing pinned at the ceiling of the scale. Reading is the exception, sitting at the very top of Strong. For a student performing at this level, reading is the thing worth working on, and again the report cannot tell you which part: inference, author purpose, comparing viewpoints, or something narrower. One dot, no diagnosis.
Profiles move more than parents expect
Here is the same student as Student B, four years earlier.
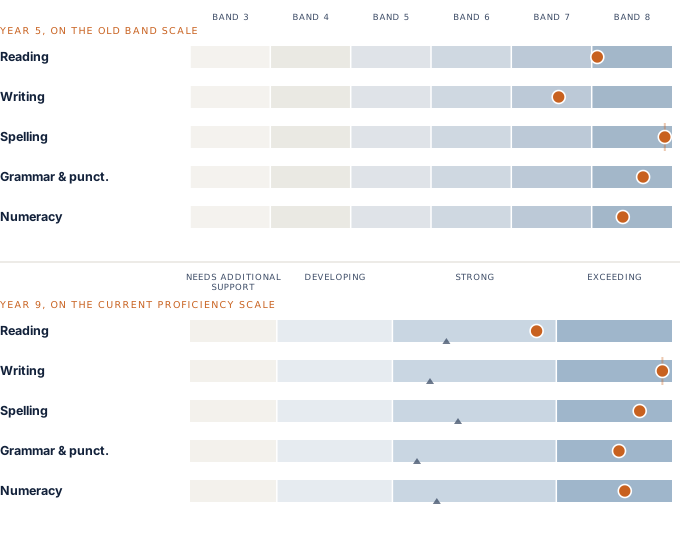
The NAPLAN scales were reset in 2023 and proficiency levels replaced the Band 1 to Band 10 reporting. The two scales are not directly comparable, so read this as a comparison of shape within each year, not as a measure of points gained.
In Year 5, writing was the lowest placed of the five domains, the only one outside the top band. By Year 9 it is the strongest, sitting at the top of the scale. Reading has gone the other way: top band in Year 5, and now the one domain outside Exceeding.
Neither shift is visible from a single year's report. It is only visible by putting two reports side by side, which is exactly what schools do when they ask for NAPLAN history with an application, and exactly what most families never do at home.
What sensible preparation looks like
ACARA's position is that students are not expected to study for NAPLAN, and for the underlying skills that is correct. Reading comprehension and numeracy are built over years, not weeks. Two things are worth preparing for anyway.
Format familiarity. A capable student who has never dragged an answer into a gap, or who does not realise the spelling section locks behind them, loses marks that have nothing to do with literacy. Familiarity removes that tax entirely.
Timing. Nine reading units in 65 minutes is roughly seven minutes per text and its questions. Students find this out on the day unless they have practised against a clock.
What is not worth doing is cramming new content in February. NAPLAN sits early in the school year, so the majority of items are drawn from curriculum taught in previous year levels. The handful of harder items pulled from the current or following year are written so they can be solved by reasoning from the text or the numbers, not by knowing a concept the class has not covered yet.
Diagnose, do not just score
A practice test that returns "32 out of 39" tells you almost nothing you can act on. The useful question is which wrong answer the student picked and what belief produced it.
Choosing a detail from paragraph two as the main idea of a passage is a different problem from choosing an answer that paraphrases the text correctly but answers a question that was not asked. Both look identical on a score sheet. They need different teaching. The same is true in numeracy, where a wrong option is usually engineered to catch one specific error, such as dividing when the situation calls for multiplying, or reading the axis scale as ones when it increments in fives.
AdaptAce NAPLAN packs
We build a 10 test pack for each subject at each year level, so a Year 5 family can work through 10 reading papers, 10 conventions of language papers, 10 numeracy papers and 10 writing tasks.
- Item counts and time limits matched to the real test at each year level, including the 52 item conventions of language structure and the split non calculator section in Years 7 and 9
- Audio dictation spelling and both proofreading formats, not just multiple choice substitutes
- Every incorrect option carries a misconception tag, so a wrong answer tells you which specific error occurred rather than only that a mark was lost
- Difficulty rises across the 10 papers so students meet the harder pathway material rather than only the average band
- Progress tracked by skill across the pack, not just by total score
Australian contexts throughout: local place names, currency, measurement and settings a student here will actually recognise.
Quick answers
+Can a student fail NAPLAN?
No. There is no pass mark. Results are reported against four proficiency levels and are designed to show where a student sits and how they are progressing.
+Can we withdraw our child?
Withdrawal and exemption are possible through the school principal. Worth weighing against the fact that several schools request NAPLAN reports at enrolment, and a missing result has to be explained.
+Is a calculator allowed?
Years 3 and 5 have no calculator. Years 7 and 9 begin with a non calculator section focused on mental calculation, then move to a calculator allowed section. The first section locks once they move on.
+Does the writing prompt differ between year levels?
Years 3 and 5 draw from one small group of prompts and Years 7 and 9 from another. Within a year level, the prompt changes each day of the writing window. Students do not choose.
+When do results arrive?
Schools receive their reporting first, then individual student reports are distributed to families through the school. Timing is set by each state or territory test administration authority and generally falls around the middle of the year.
+Which year's results do scholarship applications need?
Almost always the most recent report available. Check each school's documentation list, since some name a specific year, such as Year 3 results for Year 7 applicants.
Test structure, item counts, timings, content proportions and proficiency level definitions in this article are drawn from the Australian National Assessment Program Literacy and Numeracy (NAPLAN) assessment framework, published by ACARA and updated December 2025. School documentation requirements are drawn from the enrolment and scholarship pages published by each school named. Requirements change year to year, so confirm details with the school before applying.
NAPLAN is a trademark of the Australian Curriculum, Assessment and Reporting Authority. AdaptAce practice material is written independently and is not endorsed by or affiliated with ACARA.